Helium LoRaWAN Solana incentives 12 sensors • Zenica

A decentralized air-quality sensor network for Zenica.

We’re deploying a city-scale network of low-power sensors that stream real-time air quality data via Helium LoRaWAN, with optional Solana-based incentives and token-gated API access.

Coverage

Rooftops + poles + indoors

Telemetry

PM + gases + meteo

Goal

Hyper-local public insights

Hero placeholder

The "famous" ironworks smoke above Zenica. Picture taken in autumn 2025.

The story behind PollutionIQ

Why this started, why it matters, and why data has to be part of the answer.

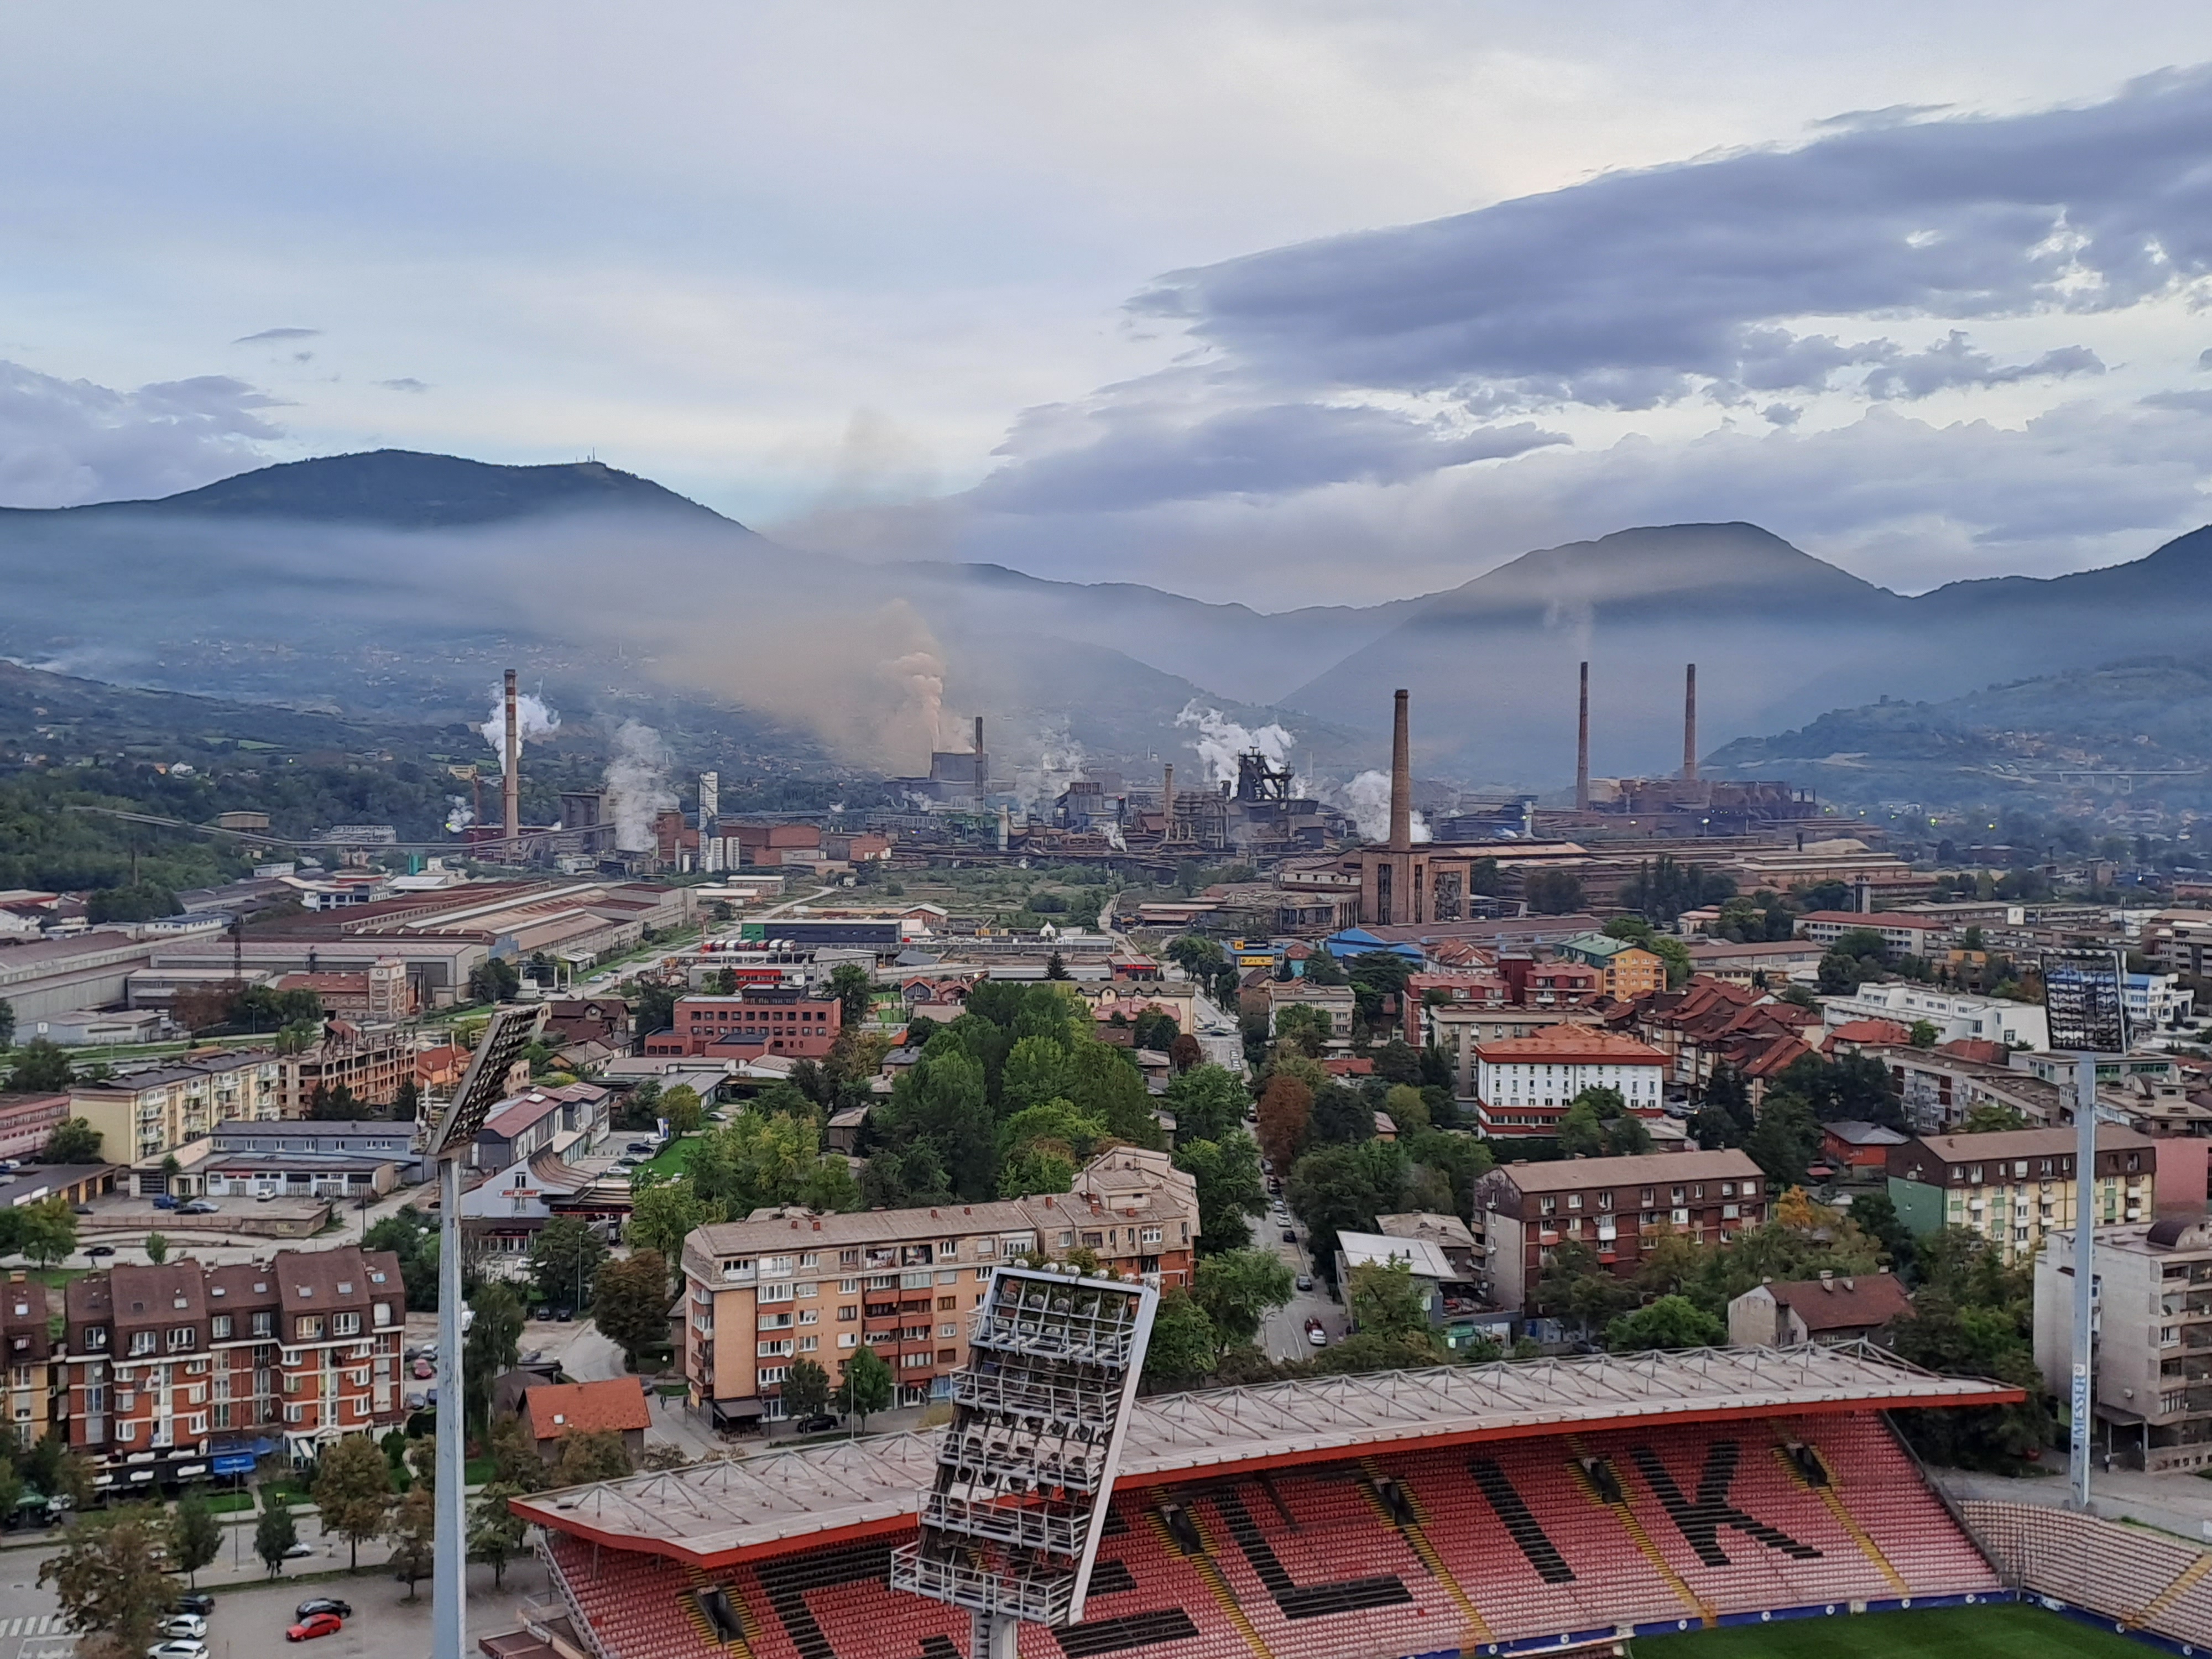
I grew up in Zenica. In winter, the city often doesn’t breathe — it suffocates. You open the window and instead of fresh air you get the smell of smoke, a gray sky that sticks to your face and goes down your throat.

Today I have an 8-year-old girl. For me it’s no longer about what we’re used to, but what we’re leaving behind. Data is still scarce: only a couple of measurement stations cover a city of 100,000+ residents, and even those are unreliable.

The goal is simple: bring data where it doesn’t exist, so we can see patterns, spikes, and sources clearly — and respond with facts instead of guesswork.

Placeholder map of air quality readings

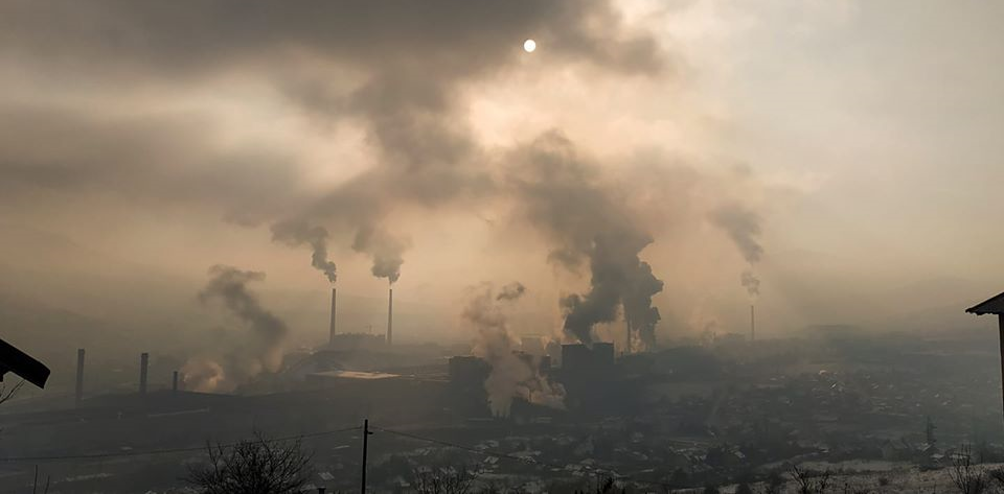
A glimpse of the problem we want to make visible in Zenica.

What we’re building

A practical deployment: hardware + connectivity + dashboard + operations. Making Zenica one of the best-mapped air quality landscapes in the region. Built to scale beyond Zenica.

01

Two sensor tiers

Basic nodes measure PM2.5/PM10 (+ temperature/humidity). Advanced stations add NO₂, O₃, CO₂ and richer environmental context.

02

Helium LoRaWAN transport

Each node sends periodic readings (e.g., every 5 minutes) over LoRaWAN to nearby Helium hotspots for low-cost, long-range uplink.

03

Dashboards + API

Data forwards from Helium Console into a cloud dashboard (fast start) and optional API for research, media, and apps.

End-to-end data flow

Sensor Node → Helium Hotspot → Helium Console (decode) → Dashboard & Storage → Public maps, charts, alerts, and API.

  • • OTAA join + encrypted payloads
  • • Payload decoder in Helium Console
  • • Data trasport via Solana blockchain
  • • Webhook/MQTT integration to the data platform
  • • Optional export/backup to your own storage
Architecture placeholder

Project architecture diagram.

Why LoRaWAN • Why Helium

LoRaWAN gives low-power long-range telemetry; Helium adds decentralized coverage + predictable data costs.

LW

LoRaWAN benefits

Designed for small packets, long range, and battery-first devices. Perfect for city-wide sensing without Wi‑Fi or SIM cards.

  • • Long range, low power
  • • Works well on rooftops, poles, and indoor windows
  • • Ideal for periodic readings (minutes-level)
HNT

Helium advantages

Community-run hotspots forward sensor traffic. We avoid building private gateways in most areas, while still getting redundancy.

  • • Decentralized coverage with many hotspots
  • • Low, predictable costs via Data Credits
  • • Easy integrations (HTTP/MQTT) from Console

Why crypto at all? Why Solana?

Crypto is the incentive layer: it motivates hotspot operators to provide coverage and enables micro-rewards for sensor hosts. It also opens the door to token-gated data access for commercial users while keeping public health alerts free. Solana provides the high-speed, low-cost infrastructure necessary to handle the massive volume of micro-transactions and state updates generated by Helium's global network of devices. This integration allows Helium to scale efficiently, ensuring that data transfer remains affordable and reliable while leveraging Solana's security for identity management and payments.

Sensors & node configurations

Two deployment tiers. Modular hardware for faster build + easier maintenance.

Sensor placeholder

Basic Particulate Node

Best for wide coverage. Lower cost, simpler installs.

  • Measures: PM2.5, PM10 (+ temperature, humidity)
  • Locations: rooftops, poles, windows
  • Power: mains where available, otherwise battery + solar
  • Typical interval: 5–10 minutes
Sensor placeholder

Advanced Air Quality Station

Fewer units, higher value. Key hotspots near industry/traffic.

  • Measures: PM2.5/PM10, NO₂, O₃, CO₂, temperature, humidity
  • Goal: richer insights + better correlation with health impacts
  • Power: mains preferred; solar possible with careful design
  • Calibration: periodic checks and drift management

Example hardware direction (editable)

We prioritize availability, community support, and reliability. Typical build approaches include modular stacks (e.g., WisBlock) or ultra-low-power boards for PM-only nodes.

PM sensor

Plantower / SPS30

Env

BME280 / SHT31

CO₂

SCD30 / Senseair

LoRaWAN

Low-power MCU + radio

Solana integration

Tokens aren’t the product. They’re the incentive layer and (optionally) the access-control layer for premium data consumers.

Micro-rewards for hosts

Reward sensor hosts for uptime and care. Simple monthly payouts using Solana wallets with tiny transaction fees.

🔒

Token-gated API

Offer commercial API tiers where holders of a token/NFT get access to higher-resolution or historical data exports.

🧾

Transparency by default

Public transactions enable a transparent rewards ledger and clearer accountability for community incentives.

Keep it simple at launch

We will start with a normal dashboard (public AQ visuals + free alerts). Then we will add tokens later: first manual payouts, then automations, then optional smart-contract logic once data quality and operations are stable. If our finances allow, we will also create a special Android application as well as a website for interpreting the results.

This is not a profit-making project

PollutionIQ is built as a public-good project: once the air-quality data is available, it benefits everyone, which makes direct monetization difficult without a clear paying customer (e.g., institutions, industry, or sponsors). Meanwhile, the real costs—hardware, installation, upkeep, connectivity, and data infrastructure—are ongoing, so the project is designed for impact and transparency first, not profit.

Whitepaper

This is where our full project proposal / investor document lives.

Download the document

A structured proposal covering deployment plan, architecture, costs, timelines, and sustainability.

What’s inside

  • • Objectives + stakeholder benefits
  • • Hardware tiers (basic vs advanced)
  • • Data flow and dashboard strategy
  • • Incentives and monetization options
  • • Deliverables & timelines

Minimum Viable Product (MVP) sensor

Live dashboard (auto-refresh)

Minimum Viable Product (MVP) sensor

Example of a temperature and humidity sensor. The sensor is located indoors and its location can be seen on the map on the dashboard. It is configured to send data every 30 minutes.

Last refreshed:

Support the project

Donations help us fund sensors, hosting, and ongoing operations.

Contact

Investors, partners, hosts, and contributors: reach out. The fastest route is email or LinkedIn.

Message Emir

Use the form or contact directly at [email protected] or LinkedIn.

What I’m looking for

Investors / sponsors

Fund initial deployment + operations. Get visibility and early access to datasets and analytics.

Sensor hosts

Rooftops, poles, windows. We handle hardware and maintenance schedule.

Partners

Universities, NGOs, local media, health orgs, and smart-city stakeholders.